Distributed Tracing for Multi-Agent LLM Systems
Hierarchical spans and explicit context propagation enable accountability across agent boundaries.
- Written by
- Tariq Nwachukwu
- Published
- October 19, 2026
- Reading time
- 9 min read
- Sources cited
- 3 sources ↓
What this covers
Distributed tracing for multi-agent LLM systems must capture a connected execution. That requires a hierarchical span model and explicit context propagation across agent, process, and network boundaries. Together, they make it possible to attribute failures, cost, and actions to the agents responsible, turning tracing from a debugging aid into a foundation for accountability.
Why multi-agent systems break classical distributed tracing
Classical distributed tracing was built around bounded request-response paths, with spans nesting under a request as it passes through services. Agents make that shape more complex because they use dynamic routing and do work that is loosely coupled. A planner can delegate to a specialist that queries a vector database and invokes a remote MCP tool before another agent validates the result. Each transition introduces a failure point and a boundary where trace context can disappear. Flat per-call logs preserve individual operations but lose the relationships that explain the execution.
The cost model also differs because token consumption matters at both the span and service levels. Request rate, error rate, and p99 latency cannot show which agent used tokens or why. Delft/JetBrains research on llmmas-otel identifies the broader engineering gap, namely the difficulty of inspecting, debugging, and evaluating LLM-based multi-agent systems under controlled failures. Its motivation is structured, comparable execution data across workflow phases, agents, tools, and LLM calls.
The failure modes that become invisible without cross-agent tracing
For an engineer, disconnected logs make a cascading tool error difficult to distinguish from a handoff failure. For an SRE, service-level p99 latency cannot attribute delay to a particular agent. A product lead sees a wrong answer without knowing whether it came from the planner, a tool, or the transfer between agents. These are different responsibilities blocked by the same missing evidence, which is the path connecting the operations.
Cost and compliance failures make that gap more consequential. An agent retry loop can accumulate token charges without producing a signal in request-level monitoring, leaving the bill as the first warning. Production cost governance therefore requires token tracking per agent, per run, and per user. Compliance teams also need evidence of which agent emitted regulated content. Crew Scaler’s security analysis identifies risks including Agent-Tool Coupling, Memory Poisoning, and Trust Exploitation, making visibility across agents a security concern as well as an operational one.
What a connected trace across agent boundaries actually looks like
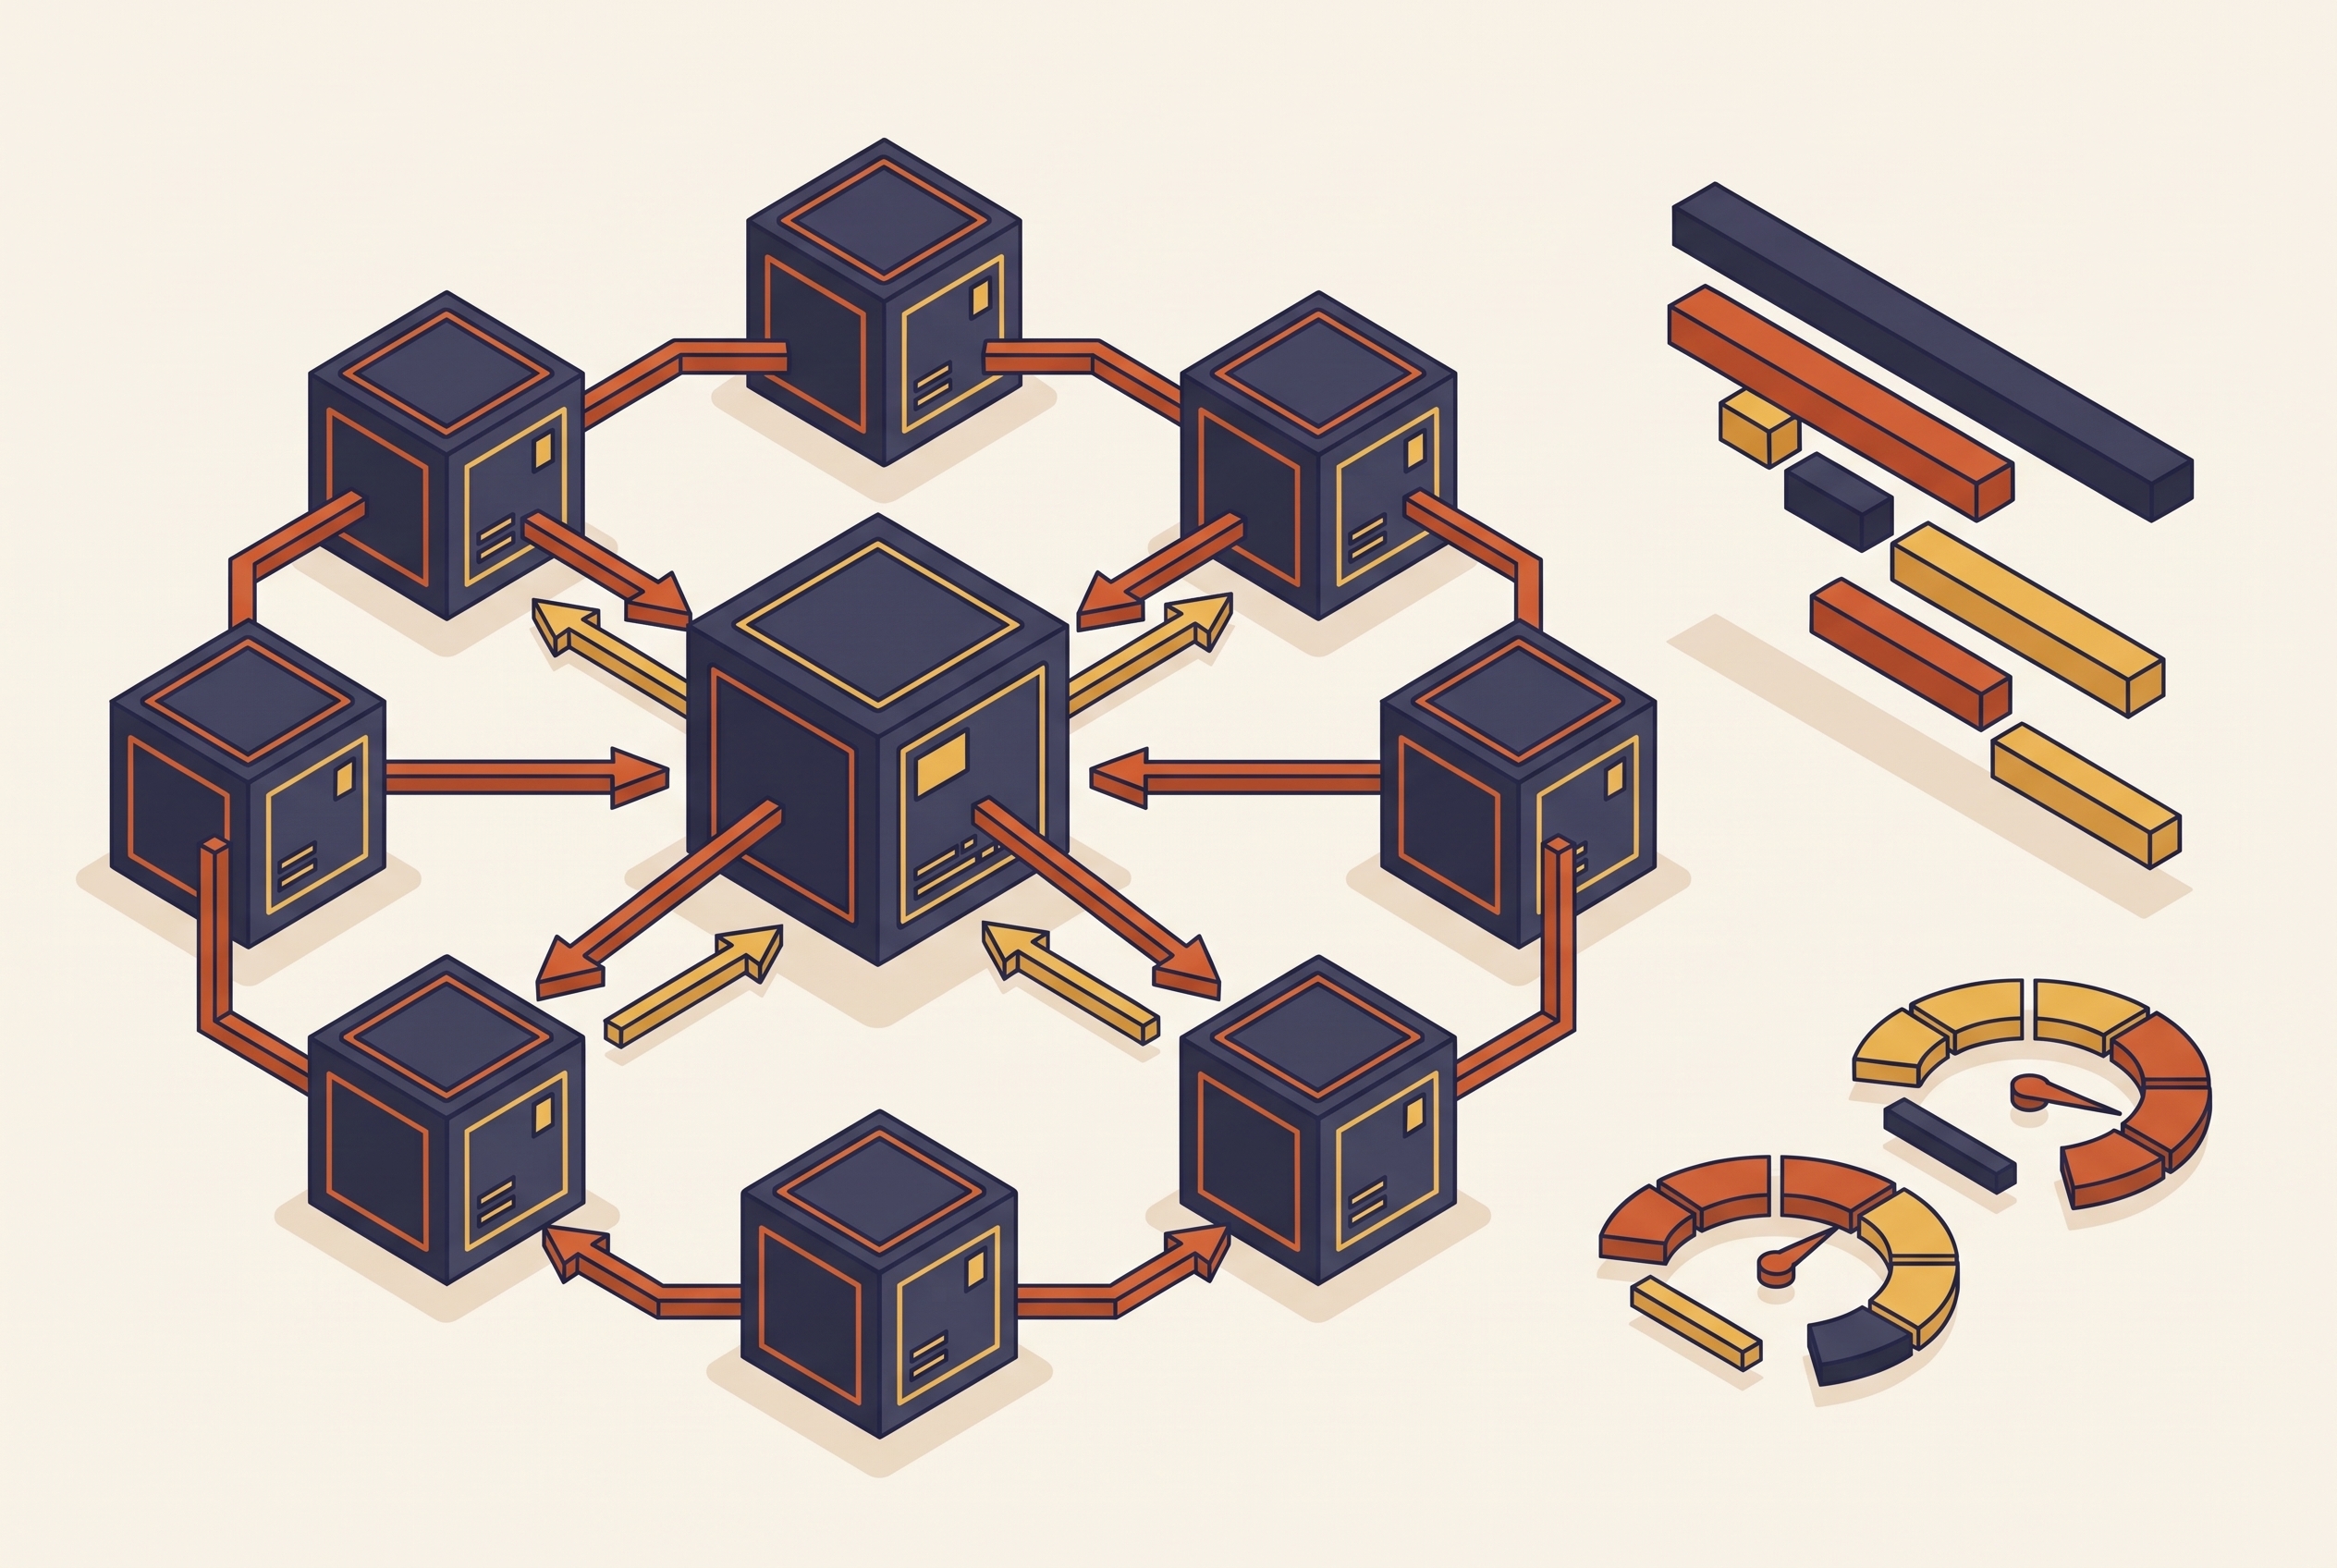
One root trace ID ties together the path the whole team takes. Each agent run has a span, with its LLM calls, tool invocations, retrievals, and handoffs represented beneath it. Picture a tree with a supervisor span at the top and specialist agent spans underneath. Each specialist has separate branches beneath it for its model call, vector database lookup, and remote tool invocation. The connecting lines carry causality, allowing a handoff failure to be distinguished from a tool failure.
The tree changes with the coordination pattern. A planner with parallel executors creates branches whose slowest execution bounds the fan-out latency, while a researcher, writer, and critic form a sequential chain. Agent-to-agent handoffs, shared-memory reads, and inter-agent messages need operation types distinct from tool calls. OpenTelemetry’s vocabulary includes invoke_agent, chat, execute_tool, and embeddings. Red Hat’s it-self-service-agent quickstart illustrates the connected structure across a request manager, agent service, integration dispatcher, Llama Stack, and MCP servers.
How context propagation keeps the trace connected across process and network boundaries
That tree survives deployment only when each boundary carries its context forward. For HTTP calls, the W3C Trace Context standard carries trace context in the traceparent header. Each agent process must explicitly receive and re-emit it rather than assume it travels through environment variables or shared memory. A dropped context turns downstream work into an orphaned fragment disconnected from the initiating execution.
Red Hat’s eventing architecture shows how the same requirement applies outside direct HTTP calls. The request manager publishes a CloudEvent, and the eventing layer routes it to the agent service. Trace context must be injected into the event envelope and extracted by the consumer to continue the trace. For a remote MCP tool call over HTTP, the request must forward traceparent to connect the tool-server span. For shared-memory retrieval, passing the trace ID as a query attribute links the lookup to its initiating agent.
Propagation must also cover the whole team. Instrumenting one agent leaves gaps wherever an uninstrumented agent receives or delegates work. Treating inter-agent messages as tool calls obscures their distinct propagation requirements. The framework-agnostic llmmas-otel tool instruments inter-agent communication and tool calls with trace-aligned telemetry, supporting comparisons between baseline and fault-injected executions.
Why OpenTelemetry's GenAI semantic conventions are the right substrate — and where they still fall short
OpenTelemetry provides a vendor-neutral foundation that separates instrumentation from the backend receiving it. Compatible exporters let teams use Jaeger, Tempo, Zipkin, or Datadog without making a proprietary span format their application contract. The GenAI SIG, formed in April 2024, expanded its scope from LLM client calls to agent orchestration, MCP tool calling, content capture, and quality evaluation. Standard operation names also include create_agent and invoke_workflow, while attributes such as gen_ai.agent.id and gen_ai.conversation.id support consistent attribution.
These conventions are in Development status. In June 2026, they moved into a dedicated semantic-conventions-genai repository to support faster iteration. Teams should use them to instrument their systems now instead of tying those systems to proprietary formats, but should expect them to change. Dedicated MCP semantic conventions are also in Development status. Using the same terms helps most when LangGraph, custom orchestrators, and vendor-hosted agents all take part in an execution.
Even that vocabulary does not capture every semantic artifact. Retrieved evidence, generated claims, tool-call rationales, memory items, and natural-language observations need instrumentation beyond standard span attributes. Prompt and response bodies are separate events that teams must turn on instead of default attributes because they often contain PII.
Instrumenting a multi-agent system in practice — what to capture at each span type
An invoke_agent span should carry gen_ai.agent.id and gen_ai.conversation.id so its children remain attributable to an agent and session. A chat span should record the input and output token counts, the model name and version, the request parameters including temperature and max tokens, and the latency. These fields expose the model choice and consumption behind a call. If prompt and response events are enabled, the team runbook should document the PII and compliance trade-off.
An execute_tool span should sit under the agent that invokes it and record the tool name, the input arguments, the output or error, and the latency. A handoff needs different evidence, namely sending and receiving agent IDs, a handoff timestamp, and the message or task payload subject to PII handling. The outgoing agent closes its span, and the incoming agent opens a child span within the same root trace. Retrieval instrumentation should capture the query, number of results returned, and latency, tied to the initiating agent. Embedding operations and vector database reads should remain identifiable as distinct operations within the trace.
Uniform sampling can discard rare failure trajectories, so traces containing any span error should be sampled at full fidelity. Red Hat’s it-self-service-agent uses OpenTelemetry version 1.37.0 with a remote OTel collector. It shows how spans are sent end-to-end across the request manager, agent service, Llama Stack, and MCP servers.
Post-hoc failure diagnosis — reconstructing what went wrong from a complete trace
A complete trace is necessary for diagnosis, but the span displaying a failure need not be its cause. Consider a tool call that fails, followed by a successful retry returning stale data and a downstream agent producing an incorrect answer. Filtering only for error status finds the first failure but does not explain the later result. Diagnosis must follow the causal chain.
AgentTrace explores that approach as an academic tool. Presented at the ICLR 2026 Workshop on Agents in the Wild, it reconstructs directed acyclic graphs from execution logs and walks backward from error manifestations. It ranks candidate root causes using structural and positional signals without LLM inference at debugging time. The 2026 preprint “From flat logs to causal graphs” pursues the same direction, showing a research approach that complements span-first observability.
Step-level evaluation is equally important because the actions a trace records require assessment for correctness. Trajectory evaluation scores the full sequence of actions against the goal they were meant to reach, so it needs the complete execution tree. Per-call logs cannot provide that context. Better capture removes an evidence gap, but accurate root-cause analysis still depends on how that evidence is interpreted.
Tracing tools for multi-agent systems and how to choose between them
Lyzr’s Opencontroller is a strong fit for multi-framework, multi-cloud deployments that need governance as well as visibility. Built on OTel, it provides a root trace for each execution, token and credit consumption, and a span waterfall from session start through orchestration to the response. Its distinction is identity attribution combined with policy enforcement in the request path. Trace evidence can support refusing a call or stopping, restricting, or isolating an agent. That makes it more than a lightweight trace viewer for a single framework.
For teams prioritizing open-source deployment, Langfuse is permissively licensed, self-hostable, and supports tracing over OTLP. Arize Phoenix is OTel-based, notebook-first, and self-hostable, combining traces and evaluations. LangSmith offers deep LangChain and LangGraph integration as closed-source SaaS, with self-hosting available as an Enterprise-only add-on requiring a paid license and Kubernetes. Its fit is strongest when the stack stays within those frameworks.
Existing infrastructure provides another selection axis. Jaeger offers a neutral OTel backend for agent traces beside microservice telemetry, though it lacks LLM-specific span rendering out of the box. Datadog LLM Observability combines APM and LLM monitoring for teams already invested in Datadog. Maxim AI combines tracing, online evaluations, CI/CD regression gating, and OTel interoperability. The choice depends on how many different frameworks the team uses, its self-hosting needs, how much evaluation it needs, and whether the system must enforce policy as well as show what happened.
Privacy, compliance, and security constraints that shape what you can safely trace
Richer traces create obligations because prompts can contain personal, confidential, or medical information. Sending that content to an observability backend without sanitization creates compliance risk under GDPR, HIPAA, and similar frameworks. Explicit content capture should therefore be a documented decision. Regulated teams that capture prompts should use self-hosted trace storage by default, while those using SaaS need data processing agreements and tight limits on what they send.
Metadata also deserves attention. Crew Scaler’s MAS security analysis identifies Data Leakage as an under-addressed risk category, and observable token patterns can reveal sensitive query complexity or expensive model routing. Tracing depth, storage and processing cost, and compliance form a three-way trade-off that should be documented per agent type. A low-risk question-answering agent may need claim-level citation and post-hoc audit in place of full prompt capture. Thoughtful instrumentation, including enforcement where required, is the responsible response to these constraints.
Designing for observability from the start rather than adding tracing after deployment
Observability becomes actionable when agent design defines what the trace must explain. Span boundaries and required attributes belong in that design, and agent interfaces should make context propagation explicit. Prompts and agent configurations also need versioning so a trace can connect a regression to a specific change. These choices make the trace a specification of expected behavior rather than merely a record collected after deployment.
Evaluation then closes the development loop. Offline evaluation and CI/CD regression gates should block changes to agents or prompts when metrics from traces get worse, which Maxim’s integration supports. Anthropic’s production experience shows that full production tracing enabled systematic diagnosis and correction of previously opaque agent failures. As agents take responsibility for cloud operations, financial workflows, and other agents, that visibility serves a wider purpose. A connected trace makes it possible to establish who acted, under which policy, and with what outcome, making observability a governance requirement.
Methodology & sources
- Security Considerations for Multi-agent Systems
Provided the security risk taxonomy for multi-agent systems, including Data Leakage, Agent-Tool Coupling, Memory Poisoning, and Trust Exploitation, cited in the sections on compliance and security.
- Observability and Fault Injection for LLM-Based Multi-Agent Systems in Software Engineering
Provided the research framing for llmmas-otel, the difficulty of inspecting and debugging LLM-based multi-agent systems, and the approach of instrumenting inter-agent communication with trace-aligned telemetry for fault-injected comparisons.
- Distributed tracing for agentic workflows with OpenTelemetry
Supplied the Red Hat it-self-service-agent quickstart architecture details, including the request manager, agent service, integration dispatcher, Llama Stack, MCP servers, eventing model, and OpenTelemetry version used.