Latency Profiling in LLM-Backed Agent Pipelines
Decomposed traces reveal where agent pipelines actually bottleneck.
- Written by
- Marcus Oyelaran
- Published
- November 2, 2026
- Reading time
- 8 min read
- Sources cited
- 6 sources ↓
What this covers
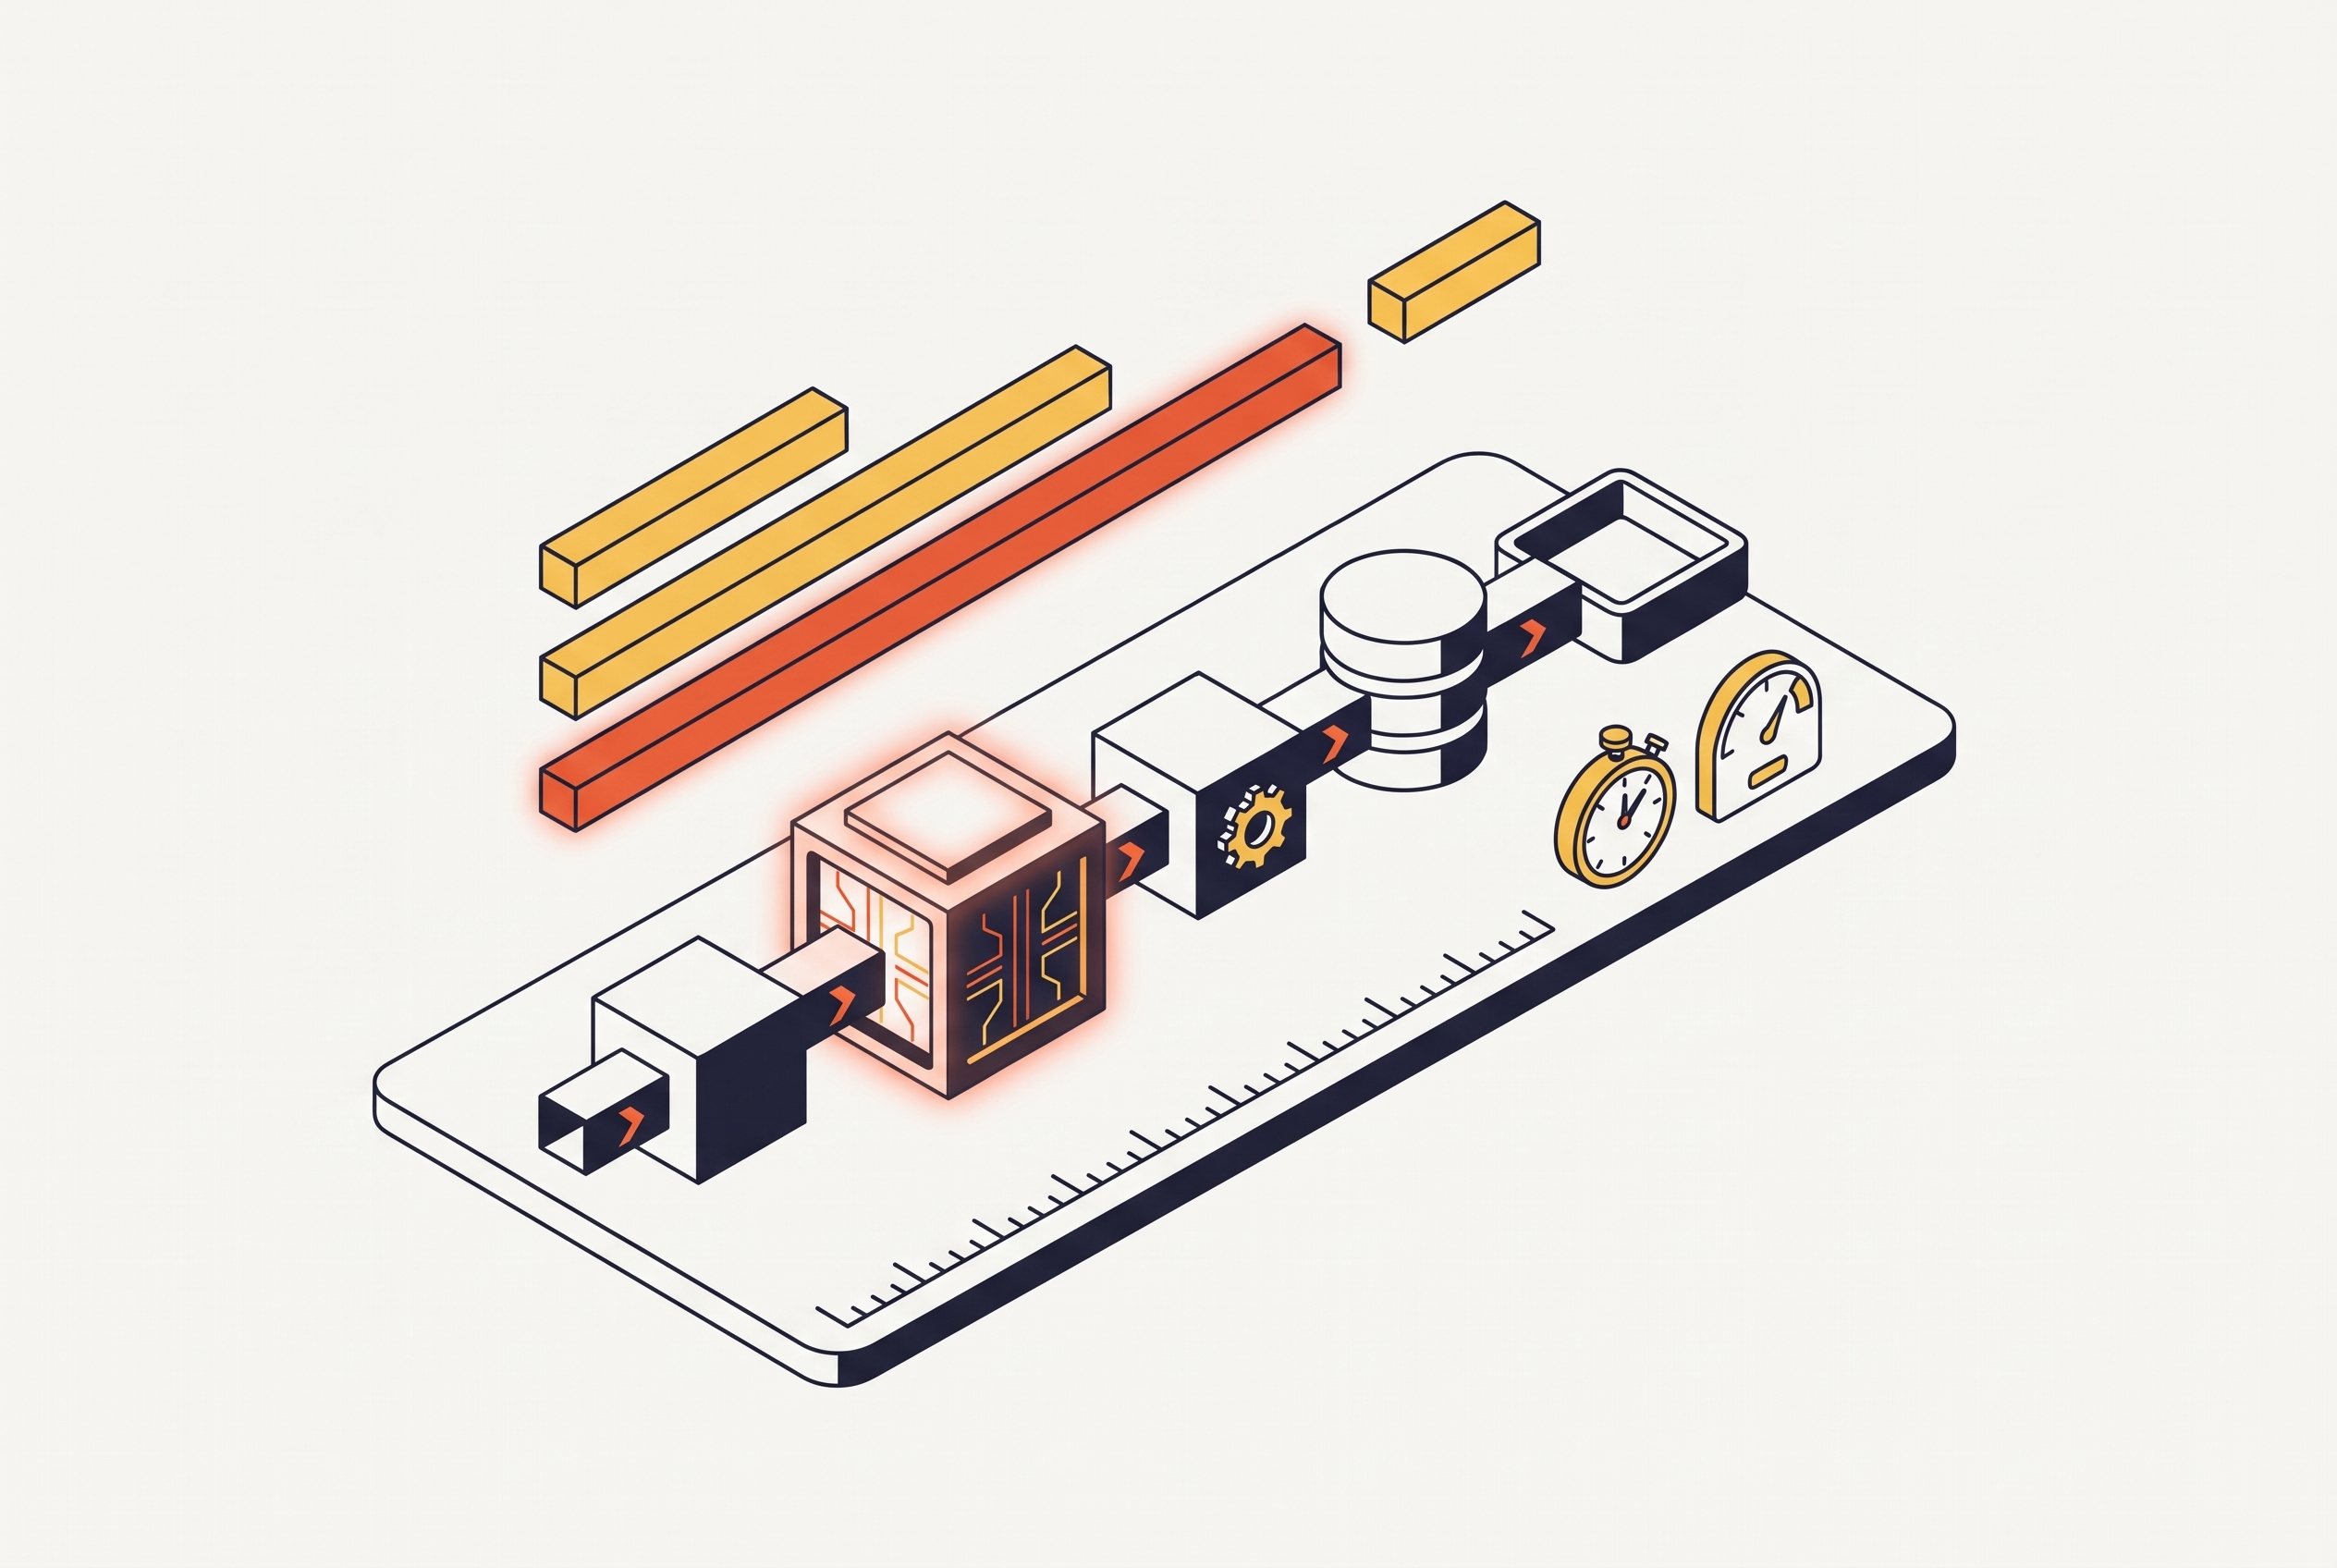
Latency profiling in LLM-backed agent pipelines requires a different mental model from profiling a single model call. End-to-end delay spans inference, retrieval, tools, sandboxes, protocols, and orchestration. Because the bottleneck moves with the workload and execution structure, effective optimization begins with decomposed traces.
Why standard inference benchmarks misread agent pipeline latency
A faster model feels like the obvious fix for a slow agent. Single-call benchmarks reinforce that intuition by measuring inference in isolation. Yet a five-step pipeline with an LLM call at every step can take a lot of wall-clock time to produce useful output, even when each call looks fast. Each decision waits for the action and observation that came before it. Environment transitions and tool waits therefore belong to the workload.
XPerf, developed by Wang et al. in 2026, addresses this mismatch through fine-grained trace replay. Nondeterministic LLM outputs guide agent control flow, so conventional benchmarks cannot capture serving behavior simply by repeating isolated calls. The execution path is part of the measurement. The IETF draft benchmarking methodology recognizes this distinction through a separate “Compound System configuration” for end-to-end task completion in agentic or retrieval-augmented workloads, although much of the measurement detail remains unresolved.
Where latency actually accumulates across a pipeline
AgentSysBench, released in August 2026, profiled ten representative agentic applications and found that non-LLM components dominate latency in the majority. Task latencies diverged by orders of magnitude across GPU-bound inference, memory-bound retrieval, and CPU-bound sandboxes. Search-heavy applications illustrate the distribution. Search accounted for a substantial median and mean share of session latency, while Bian et al. found in 2025 that web environment latency could account for more than half of overall latency in web-interactive systems. Model inference is only one possible center of delay.
The serial action–observation loop makes those delays consequential because every tool call and environment transition postpones subsequent decisions. Resource constraints can also move the bottleneck away from its apparent location. Under limited CPU allocations, delayed kernel launches, stalled communication, and elevated tokenization latency can leave GPUs severely underused. A profile that records only inference duration cannot explain this resource mismatch.
Bian et al. also found that API latency varied widely across providers, with provider-side queuing sometimes letting larger models respond faster than smaller ones. Meanwhile, richer observation formats multiply the input tokens at each step and can make inference account for a larger share of latency again. Workload design and resource allocation determine which component limits progress.
How long-tail latency — not the average — defines user experience in agent workloads
XPerf found long-tailed request latency in most agentic applications, with p95 reaching multiples of p50. Stuck agents were the primary cause. They continued issuing LLM and tool calls without terminating, extending the execution. A pipeline can therefore look acceptable at the median while delivering severe delays to a significant share of users.
The distinction changes what a latency profile must reveal. P50 is the median, and neither a median nor an average alone exposes the tail. P95 and p99 need to be first-class instrumentation targets. Termination logic also belongs in latency analysis because failure to finish is both a correctness problem and a source of prolonged resource use. Without that connection, a team may optimize calls inside an execution that should already have stopped.
Time-to-first-token records only one moment. A UX-first benchmark should instead include chunk cadence, jitter, tool-call stall time, and end-to-end time-to-usable output. Tool-call stall time runs from tool start through tool result to stream resumption. That interval captures a dominant source of delay in agent workflows that an early first token can conceal.
What MCP-based pipelines reveal about hidden overhead in protocol layers
ProMCP, published by Anjum et al. in ACL Findings 2026, shows protocol overhead by profiling six stages of communication across the Model Context Protocol’s Host-Client-Server architecture. It is the first peer-reviewed profiler built for MCP. Its decomposition exposes a counterintuitive cost distribution. In topologies with customized clients, planning and schema injection consumed the majority of both tokens and latency, while actual tool execution represented a negligible fraction of total cost across the tested configurations.
The same profiler found a different concentration in other clients, where final answer synthesis accounted for the majority of latency. Deployment topology changed the location of the bottleneck. Treating the protocol layer as opaque would hide that distinction and misattribute overhead to tool execution. The optimization target would then be the component doing comparatively little of the work. Protocol decomposition is needed even when the tools themselves seem simple.
MCP’s July 2026 revision also changed the measurement boundary by making the protocol stateless at the protocol layer. Protocol version, client identity, and capabilities now travel per request, while session-tracking state has been removed from the protocol entirely. Older measurements may no longer transfer directly. Teams need to recheck measurements of session-tracking overhead from before the revision before using them to decide how to deploy systems now.
How sequential pipeline topology creates overhead that has nothing to do with model speed
Protocol attribution explains what consumes time, but execution topology determines which delays must accumulate. The October 2026 AWS Bedrock guardrail case involved five validation layers, including policy compliance, prompt-injection detection, destructive-operation screening, contextual anomaly detection, and a final authorization gate. Sequential execution produced a baseline of 13,874 ms per validated action. Most layers did not depend on each other’s output. Their order reflected how the code had been written.
Profiling also showed that expensive checks ran before cheap ones, so early rejection could not spare work that was already done. Parallelizing independent checks and placing cheap, high-confidence checks first reduced latency dramatically. The detection logic remained unchanged. The new pipeline had the same accuracy and a zero false-negative rate on destructive operations. This case isolates a structural cost that model-side optimization would leave in place, arising from sequential code that was easy to write and debug.
Wang et al.’s 2026 paper, Latency-Aware Orchestration for Multi-Agent LLM Workflows on Heterogeneous GPUs, addresses dependency-aware execution at a different layer. Its prediction-guided runtime forecasts device-specific activation latency, peak memory, and model-loading cost, then propagates those predictions through workflow dependencies. Physical scheduling becomes an explicit optimization decision. The runtime substantially reduced end-to-end makespan and p95 completion latency over state-of-the-art workflow schedulers on heterogeneous GPU pools. This case deals with infrastructure scheduling, while the guardrail case deals with application-level checks, and both show why latency analysis needs to cover how execution is structured.
Why structured instrumentation across every pipeline layer is the prerequisite for finding these bottlenecks
To turn these diagnoses into a profiling practice, teams need a parent-child span hierarchy covering the user-facing operation and its component steps. Each LLM call, retrieval step, tool invocation, and orchestration stage needs individually attributable time. The root span anchors that hierarchy. It should begin at the start of the request lifecycle, because emitting it late or after its children can cause attribute aggregation to fail silently.
OpenTelemetry’s GenAI semantic conventions provide a common vocabulary across model providers through attributes such as gen_ai.provider.name and gen_ai.usage.input_tokens. The older gen_ai.system attribute is deprecated. OpenInference extends OpenTelemetry with tool-call-specific attributes, including message.tool_calls and tool_call.* fields. These conventions give decomposed traces a consistent schema. That consistency supports comparisons across steps without treating each provider’s instrumentation as a separate measurement system.
Large prompts and completions should be logged as span events, with scrubbing automated inside the instrumentation wrapper. Privacy protection then starts at the instrumentation source. Development and staging should use full sampling, while production should combine head-based sampling with tail-based sampling triggered on errors or high latency. Tool-call stalls also need their own measurement rather than being collapsed into aggregate agent time.
LangSmith, developed by the LangChain team, records inputs and outputs for each LLM call, measures latency and token consumption, and adapts the OpenTelemetry Span/Trace model to invocation chains. It is widely adopted, particularly among LangChain and LangGraph teams. Its collection and visualization explain what happened in an execution. MLflow is another first-class observability option that works with OpenTelemetry conventions and adds evaluation and quality monitoring to the same pipeline. Both support diagnosis through structured execution data.
What speculative execution and task-aware serving reveal about proactive latency reduction
Once traces identify the limiting component, profiling can guide proactive latency reduction. AOSpec, introduced in August 2026, co-speculates both actions and observations in the agent-environment loop, bringing together levers that prior work treated separately. It demonstrated joint speculation without lossiness. Across a range of serving settings, it cut mean end-to-end latency by 11.8–32.5%. The result shows that anticipating work can shorten the loop, provided the extra work does not create a new bottleneck.
Increasing depth or breadth makes more work compete for shared policy resources and can raise agent latency. More lookahead is not always better for latency. Profiling must distinguish time saved by anticipation from time added through resource competition. Otherwise, an apparently more aggressive optimization can worsen the delay it was intended to remove.
AgentSysBench shows how workload characterization supports other targeted interventions. Task-aware serving matches the serving strategy to the workload, while communication-aware placement helps when communication holds up the work. Tool-result caching removes redundant search calls and saves aggregate search latency, whereas state offloading reduces memory usage. SpecCache, developed by Bian et al., specifically combines caching with speculative execution to improve cache hit rates over random caching and substantially reduce web environment overhead without degrading agentic system performance.
The choice depends on the decomposed profile. Task-aware serving for an LLM-bound workload and tool-result caching for a search-bound workload operate on different portions of the execution. Structured instrumentation provides the evidence needed to select between them. It also supplies the latency distributions against which a proactive technique’s effect can be assessed, rather than assuming that an improvement in one component translates into a better end-to-end experience.
Building a profiling practice that accounts for the full pipeline
A team applying this discipline should begin by defining the complete user-facing operation, then decomposing it before choosing an optimization. The span hierarchy needs to cover inference, retrieval, tools, protocol overhead, sandboxes, orchestration, and validation. No layer earns exemption without measurement. OpenTelemetry GenAI conventions provide the shared vocabulary, while high-latency tail sampling preserves the executions most likely to expose failures of progress. Protocol revisions also need attention so that historical profiles remain relevant to the deployed architecture.
P95 and p99 show which executions run long, tool-call stall spans show where progress stops, and token consumption at each step shows context growth that can shift the bottleneck. TTFT remains insufficient on its own. Together, these measurements allow a team to distinguish a slow component from too many serial steps, excessive input, or an agent that continues without approaching termination.
Before changing the model, the team should examine whether independent stages run sequentially and whether cheap, high-confidence checks can short-circuit expensive work. It should also establish whether protocol time is separated from tool execution and whether serving strategy fits the workload’s resource demands. CPU starvation, provider queuing, and orchestration overhead cannot be diagnosed from an isolated inference score. The governing mental model is a dependent execution whose full path must be decomposed, measured, and attributed before it can be optimized.
Methodology & sources
- What Limits Agentic Systems Efficiency?
Provided data on web environment latency accounting for more than half of overall latency in web-interactive systems and on API latency variation across providers.
- Setting Up LLM Observability Pipelines in 2026
Provided background on MLflow as an observability option that works with OpenTelemetry conventions and adds evaluation and quality monitoring.
- ProMCP: Profiling Token Flows and Latency Costs in Model Context Protocol–Based LLM Agents - ACL Anthology
Supplied the ProMCP profiler findings on token and latency distribution across MCP pipeline stages, including the counterintuitive cost concentration in planning and schema injection versus tool execution.
- Latency-Aware Orchestration for Multi-Agent LLM Workflows on Heterogeneous GPUs
Supplied the findings on prediction-guided runtime scheduling for multi-agent workflows on heterogeneous GPUs, including reductions in end-to-end makespan and p95 completion latency.
- Benchmarking LLM Serving Systems for Agentic AI Workloads with XPerf
Supplied the XPerf benchmark findings on fine-grained trace replay, nondeterministic control flow, and long-tailed request latency with stuck agents driving p95 to multiples of p50.
- AOSpec: Action and Observation Co-Speculation for Low-Latency Agent Serving
Provided the AOSpec co-speculation results showing 11.8–32.5% reduction in mean end-to-end latency through joint action and observation speculation.