Observability Tooling Comparison for LLM Agent Frameworks
Production failures hide in layers standard dashboards can't reach.
The gap between what monitoring tools measure and what agents actually get wrong is where most production failures hide. An agent can pass every automated test, ship to production, and still call the wrong tool three weeks later. Uptime stays green. Latency stays flat. Error rates stay near zero. The agent just keeps handing users confidently wrong answers, and nothing on a standard dashboard flags it. That gap is what this piece covers, and it's why a wave of observability platforms has built up around it over the last two years.
The mechanism is structural. A single user request to an agent fans out across multiple LLM calls, tool invocations, vector database lookups, and sometimes handoffs between sub-agents. Any one of these steps can fail without tripping an alert. A retrieval step can return the wrong document while the HTTP status still reads 200. An agent can loop through a dozen tool calls, burn through thousands of tokens, and land on an answer that sounds right and isn't. The failure sits several layers down inside a trace tree, and a dashboard built for request-response monitoring has no way to surface it. Hallucination, cost runaway, prompt injection, and slow quality drift all belong to the same class of problem: none of them registers as an error, so monitoring built to measure uptime or latency never catches them.
A CHI 2025 study that interviewed 30 developers building with LLMs landed on four design principles any serious observability tool needs: awareness, monitoring, intervention, and operability. None of those four is logging. Each one assumes the tool can judge an output's actual quality, not just record that the output happened. That distinction, logging versus evaluation, is the thread running through every comparison below. It's also the test that separates a real observability platform from an expensive log store, and most of the tools on the market still fail it.
The market context behind the current tool proliferation
The category is growing fast enough to outrun anyone's attempt to keep a clean map of it. Gartner expects LLM observability investments to account for half of all GenAI deployments by 2028, up from roughly 15% in early 2026, which tells you where budget owners think the risk actually sits.
The demand curve and the confidence curve are moving in opposite directions, and that mismatch is the real story here. Most organizations surveyed already use some form of agent observability, yet for well over half of them, inadequate tooling is a named barrier to shipping agents into production. Teams that have adopted tooling skew heavily toward offline evaluation, run against curated test sets, rather than scoring live production traffic. That's a lot of teams flying blind on exactly the behavior that matters most: what the agent does after it ships, not what it did in a test suite three weeks earlier.
Part of the reason the gap hasn't closed is the pace of framework churn. LangGraph, the OpenAI Agents SDK, DSPy, Pydantic AI, and CrewAI have each shipped major capability jumps in rapid succession, and tooling vendors are chasing that pace rather than setting it. Every quarter tends to bring a new framework or agent pattern that existing instrumentation wasn't built to capture. The tools that survive this cycle will be the ones built on standards rather than on any one framework's internals, and that distinction will determine which tools remain useful once a framework's internals change.
The two architectural splits that sort the landscape before any feature comparison
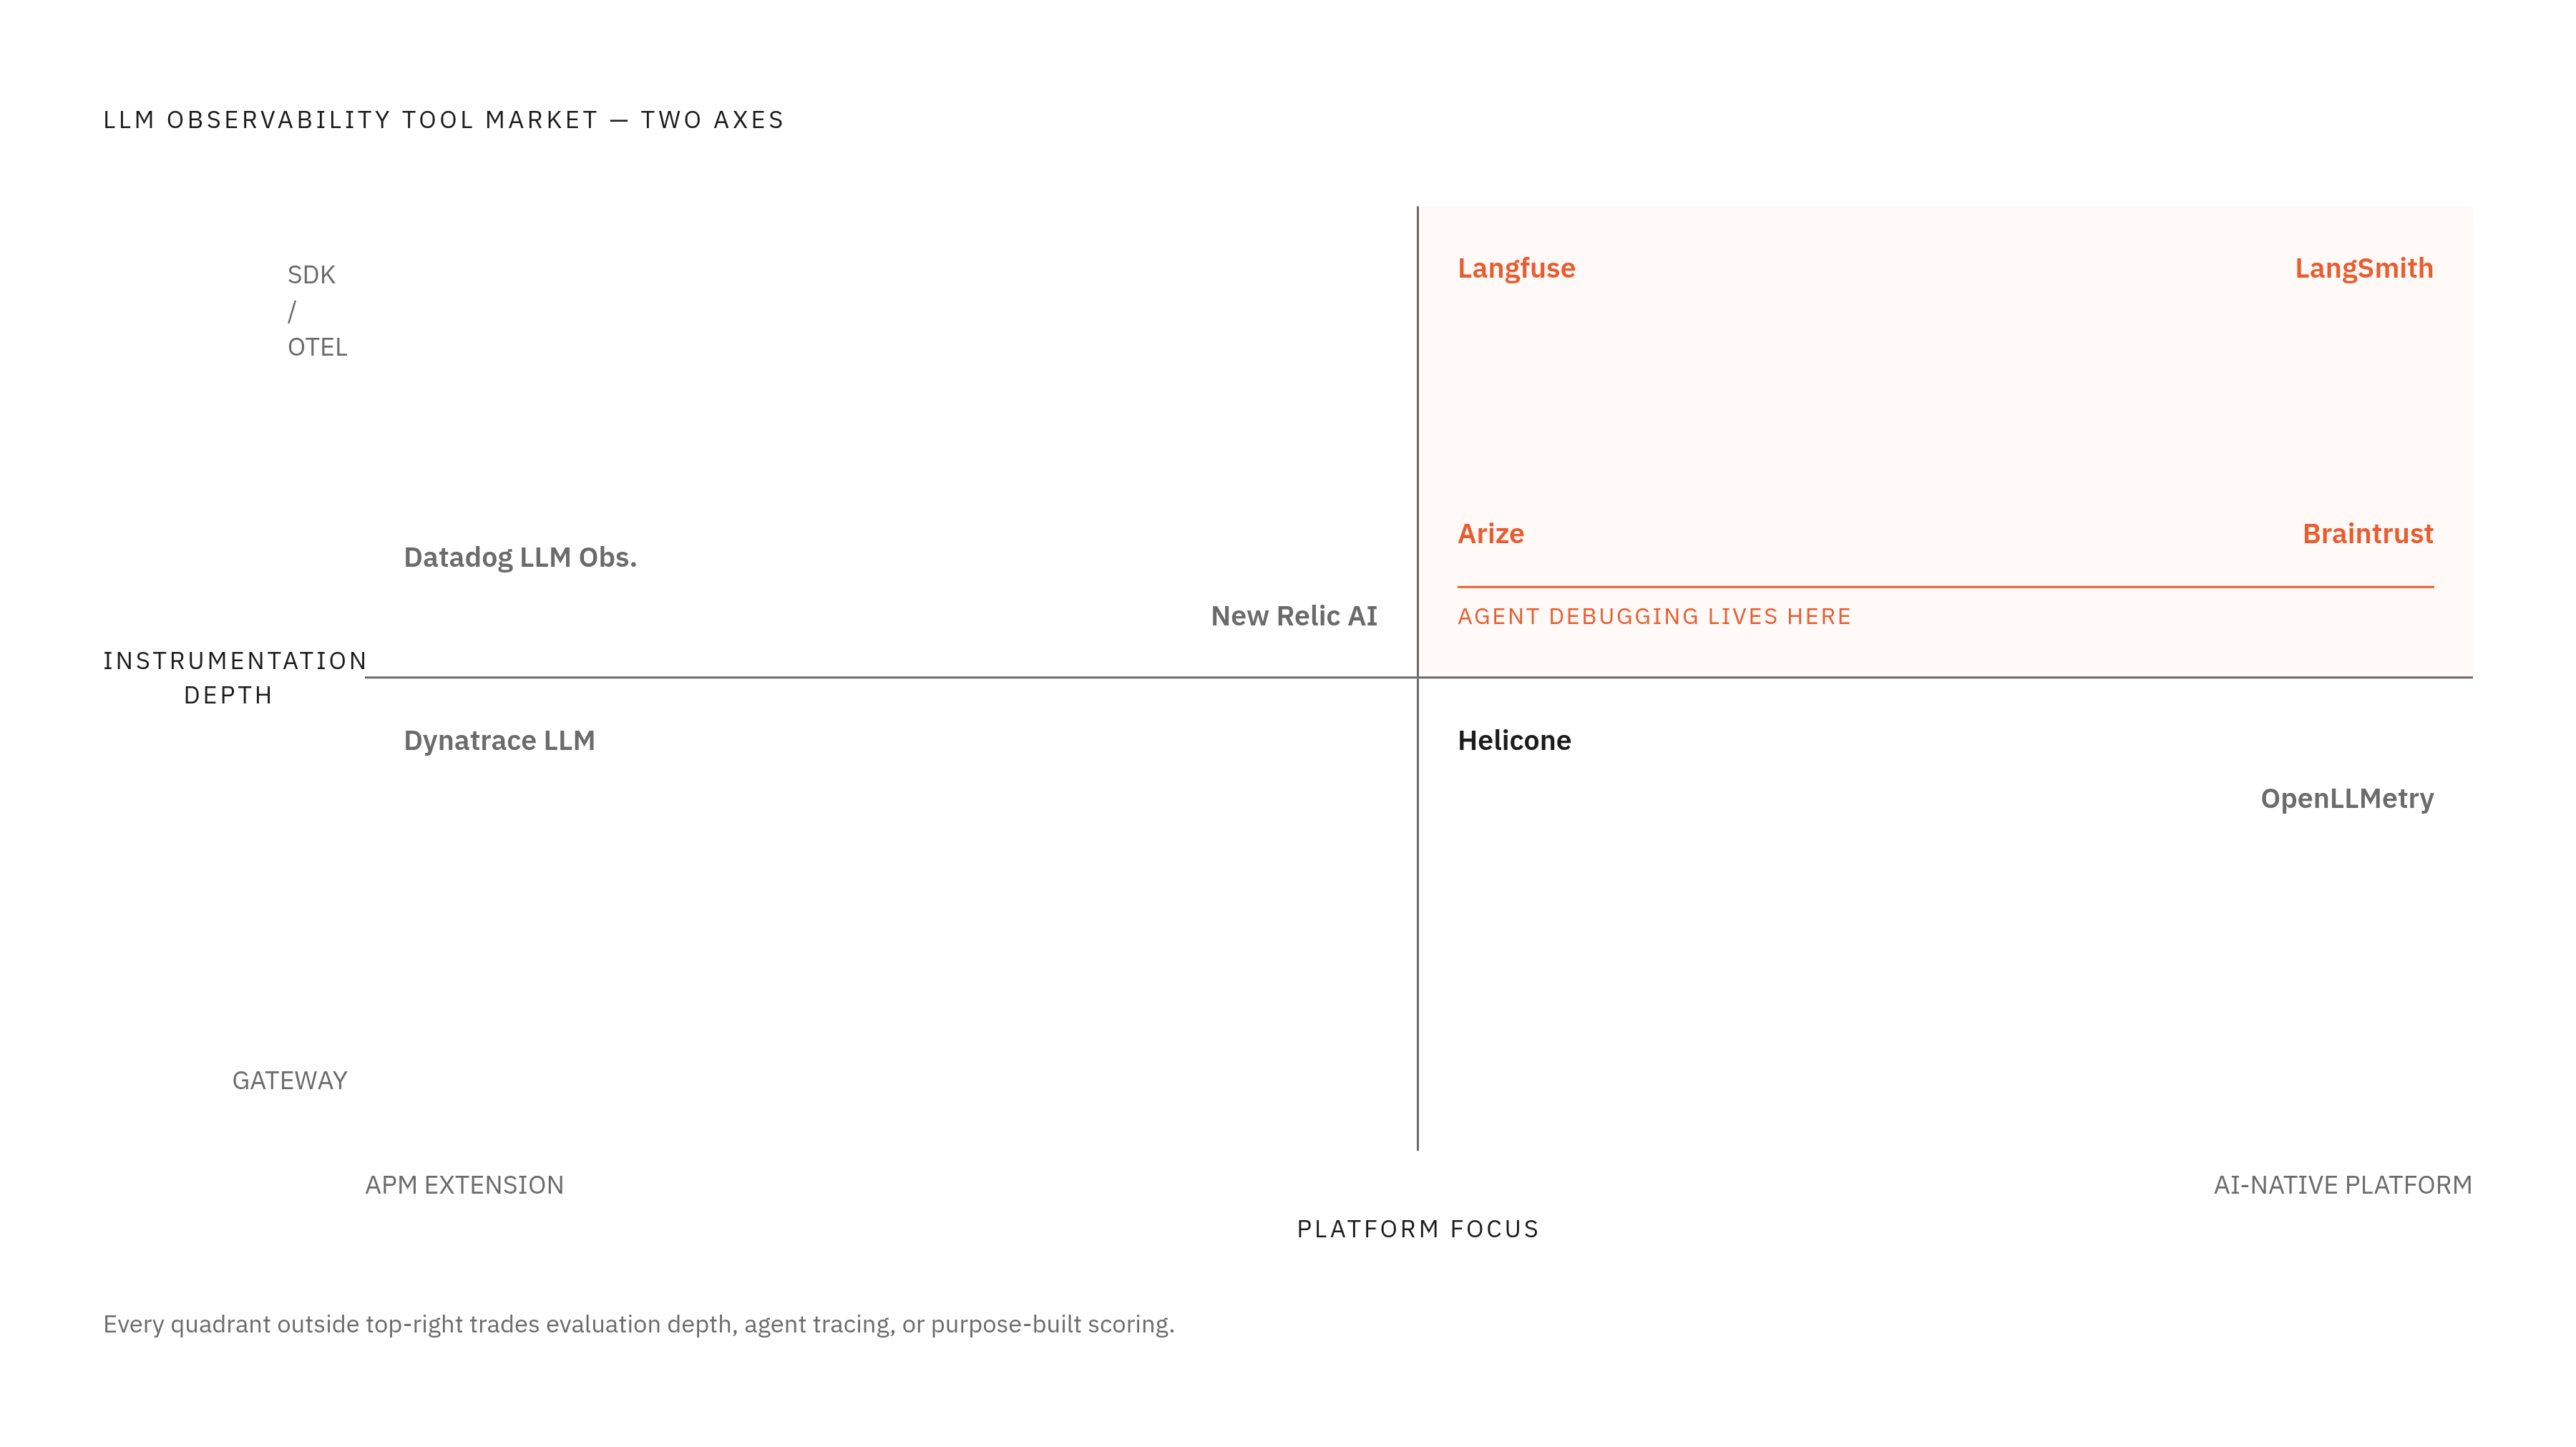
Two axes decide what a tool can and can't see, and they determine which failures a team catches before deployment and which ones surface only in production. Sort along these first, and half the vendor landscape organizes itself.
The first split is proxy or gateway versus SDK and OpenTelemetry instrumentation. Gateway tools, Helicone being the clearest example, sit in front of the LLM provider and log the calls passing through. Setup takes minutes, overhead is close to zero, but a gateway only sees the request and the response. It has no view into the orchestration graph behind that single call. SDK-based and tracing-instrumented tools trace the agent's actual steps instead: nested spans, tool invocations, retrieval calls, sub-agent handoffs, all captured inside one trace tree. If a bug lives three hops deep in an execution graph, a gateway tool will not find it. That's not a knock on gateways; it's just a description of the job they were built to do, and it's the wrong job if the failure you're chasing lives inside the orchestration layer.
The second split is AI-native platform versus APM extension. Langfuse, LangSmith, Braintrust, and Arize are built as AI-native platforms and attach evaluation scores directly to production traffic. They're built for ML engineers and product teams working the agent loop day to day. Datadog LLM Observability takes the opposite approach, bolting LLM telemetry onto an existing monitoring product. The upside there is one dashboard across infrastructure and LLM behavior. The cost is that LLM-specific depth ends up secondary to whatever the core product was built to do first, and for a team debugging agent-specific failures, that tradeoff loses more often than it wins.
A quieter fight over instrumentation standards drives both splits. Teams disagree on which standard to instrument against, and that disagreement produces the divide described above. OpenTelemetry's GenAI semantic conventions have the broadest ecosystem support, and more tools adopt them every month. OpenInference, the standard Arize Phoenix leans on, is also OTel-compatible, and tools built on either standard let a team swap backends later without re-instrumenting the whole agent from scratch.
None of this touches the dimension that actually separates a real observability setup from an expensive logging pipeline: evaluation maturity. Does the tool score the quality of an output, or does it just record that an output happened? Whether a team catches the wrong-tool-call bug before a user does, or three weeks after, depends on the answer to that question for every tool below.
What to require from any tool before comparing features
Framework flexibility comes first, and it's not a nice-to-have. The agent framework landscape isn't settling down, so a tool that locks a team into one framework becomes a liability the moment that team migrates, and given the pace of change here, that migration is a matter of when, not if. Integration breadth through OpenTelemetry beats a pile of hand-rolled connectors, because OTel support tends to outlive any single framework's popularity, while custom connectors rot the day a framework ships a breaking change.
Trace depth for agent-specific behavior comes second, and it's where the gateway-versus-SDK split from the last section really bites. A useful tool shows node-by-node state diffs, the full execution graph, a breakdown of every tool call, and visibility into sub-agent handoffs. Replay matters just as much. Can a failed trace be rerun against a new model version or an edited prompt, to check whether a fix actually worked, without waiting for the bug to happen again in production?
Evaluation integration is the requirement most tools still underserve, and it's the point to push hardest on in any vendor conversation. Can the platform score production traces as they happen? Does it treat LLM-as-judge scoring, faithfulness checks, hallucination detection, and safety metrics as first-class citizens, or as an afterthought bolted onto the trace viewer? And can a product manager or a domain expert, someone who isn't an engineer, actually sit down and review output quality without an engineer gatekeeping every cycle?
Deployment model closes the list, and it's the one buyers underweight most. Self-hosted, managed SaaS, and hybrid models carry very different implications once regulated data enters the picture. A healthcare or financial services team often cannot send raw traces to a third-party cloud, no matter how good the tool is. PII leaking into a telemetry pipeline is a real regulatory exposure with real mitigations. Licensing terms matter here too: Apache 2.0, MIT, Elastic License 2.0, and a proprietary SaaS wrapper around an Apache 2.0 core each impose different constraints on redistribution, hosting, and modification. That shapes what a company can legally do when it builds on top of the tool for years, not just what it can do on day one.
MLflow: the open-source platform built for teams that need the full agent development loop
MLflow is the most widely adopted open-source AI engineering platform on the market, with a monthly download count in the tens of millions and backing from the Linux Foundation. That scale alone makes it the default starting point for a lot of teams, but the reasons it holds that position go past the download counts.
The tracing layer is OpenTelemetry-native and supports GenAI semantic conventions for both export and ingestion, with native integrations covering OpenAI, LangChain, LlamaIndex, DSPy, and Pydantic AI. The standout capability is time-travel debugging: pause an agent run, branch off from a specific point, and replay it forward. Errors that are difficult to reproduce in testing would otherwise require waiting for the same condition to recur in production. This feature lets teams reproduce them on demand instead, which makes it arguably the single most useful capability on this entire list.
What separates MLflow from a pure tracing tool is what sits on top of the trace layer. It ships with built-in LLM judges and prompt optimization algorithms (GEPA and MIPRO among them) that adjust prompts automatically based on evaluation results instead of waiting for an engineer to notice a pattern by hand. The AI Gateway component adds a centralized governance layer across OpenAI, Anthropic, Bedrock, Azure, and Gemini, handling routing, rate limiting, fallback logic, usage tracking, and credential management in one place. MLflow also plugs into external eval libraries, RAGAS, DeepEval, Phoenix, and TruLens among them, rather than forcing a team to rip out tools it already trusts.
All of this ships under Apache 2.0 licensing, with no feature held back behind an enterprise paywall. Every capability described above is available in the open-source release, which is rare in this category, and it's the strongest argument for making MLflow the default choice rather than one option among many.
Langfuse: the open-source tracing layer with the broadest self-hosting adoption
Langfuse's adoption numbers, as of its acquisition, tell their own story: more than 2,000 paying customers, over 26 million SDK installs, over 6 million Docker pulls, with 19 of the Fortune 50 and 63 of the Fortune 500 among its users. Those numbers explain why the January 16, 2026 announcement landed as a genuine industry event rather than routine M&A: ClickHouse acquired Langfuse the same day it closed a Series D round that tripled ClickHouse's own valuation to $15 billion.
The stated plan is continuity. Langfuse's roadmap isn't changing, the project stays open source under its MIT license and remains self-hostable, and Langfuse Cloud keeps operating as it did before the acquisition closed. ClickHouse now owns the tooling that turns every LLM call into a structured, queryable record, which fits a pattern showing up across the industry: database vendors moving to own the AI feedback loop, not just store its output after the fact. Langfuse closed out 2025 with more than 20,000 stars on GitHub, a rough proxy for how much of the open-source ML community had already voted with its forks before the acquisition even happened.
Architecturally, Langfuse self-hosts on Postgres, ClickHouse, Redis, and S3-compatible blob storage, and it stays framework-agnostic through OpenTelemetry, so it sits behind essentially any LLM SDK or agent framework a team throws at it.
LangSmith: deepest tracing for teams already inside the LangChain ecosystem
LangSmith's core strength is visual. Every run gets captured as a graph showing tool invocations, reasoning steps, and multi-agent interactions, down to node-by-node state diffs across the full execution path. Traces replay against a new model version straight from production data, which shortens the loop between finding a regression and confirming the fix worked.
For a team already building on LangGraph or LangChain, LangSmith is the path of least friction, by a wide margin. The instrumentation is already wired into the framework the team is using, so there's no adapter layer to write and no semantic gap between what the framework does and what the tool understands.
The tradeoff is licensing, and it's a real one. LangSmith is proprietary, and self-hosting only comes with enterprise contracts, which puts it out of reach for any team that needs to self-host but doesn't have enterprise budget to spend. The free tier caps out at 5,000 traces a month: workable for a small project, tight for anything running meaningful production volume. LangSmith's PyPI download count runs into the tens of millions, but LangSmith installs automatically as a dependency of the langchain package itself, which inflates that figure before it gets cited anywhere. The download count reflects how many people installed LangChain, not how many people chose LangSmith on its own merits, and treating the two as the same signal wrongly credits LangSmith with adoption it did not independently earn.
Arize Phoenix: ML monitoring heritage applied to RAG and agent drift
Arize ships as two products, not one. Phoenix is free, open source under the Elastic License 2.0, local-first, and built to feel natural inside a notebook, which makes it the entry point for most users kicking the tires. The commercial Arize platform sits above it and adds drift detection, enterprise compliance features, and full-traffic production monitoring for teams that outgrow the open-source tier.
The instrumentation layer is built tightly around OpenTelemetry and the OpenInference semantic conventions, with more than 20 framework integrations already wired in. Where Arize distinguishes itself is visual analysis of RAG pipeline quality, specifically the slow, quiet drop in retrieval accuracy that doesn't trip any alert until someone happens to go looking for it. Its pre-built evaluation templates and analysis workflows run a notch deeper than what Langfuse offers out of the box. For enterprise ML teams already running Arize for traditional model monitoring, extending into LLM and agent observability is the lowest-friction move on this whole list, since both the infrastructure and the team's mental model are already in place. The OTel-native foundation gives these teams the same backend flexibility described earlier: swap the storage layer later without redoing the instrumentation from scratch.
Braintrust: fast iteration with non-technical stakeholders in the loop
Braintrust ships SDK wrappers across a wide span of frameworks: the OpenAI Agents SDK, LangGraph, Mastra, Pydantic AI, LangChain, CrewAI, and the Vercel AI SDK. That breadth covers most of what a team is likely building on in 2026 without demanding custom glue code for each one.
For anything outside that list, the BraintrustSpanProcessor accepts standard OpenTelemetry spans and logs them for observability, with GenAI semantic conventions mapping the raw spans into structured inputs, outputs, and metadata automatically. In practice, that means a team already exporting OTel spans from some other part of its stack can bring Braintrust into the loop without re-instrumenting anything. That matters most for the teams this tool is actually built around: the ones where a non-engineer, a product manager reviewing agent outputs for quality, needs a seat at the table without an engineer gating every review cycle.